Inspecting javascript on jsfiddle.net in Google Chrome
Debugger calls work fine on jsfiddle. Just enter this line where you want to start debugging:
debugger;
Debugger is great for starting debug mode in chrome, firebug and even IE dev tools, but you usually need to have the debugger started (ie "start debugging" in IE, open firebug/developer tools).
In the Developer Tools, under the Script tab if you select fiddle.jshell.net from the dropdown, around line 20-30 (depending on how much CSS you have) you will see a <script> tag that contains the code from the Javascript fiddle window. You can set your breakpoints here.
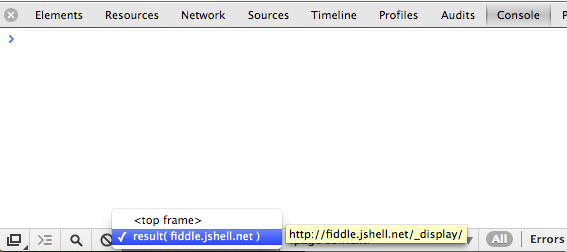
You can also evaluate code in the Console against this frame by changing the console context: